Jason George

Case study 02 · ArrowStream · Restaurant supply chain

Giving intelligent supply-chain software the interface it deserved

ArrowStream came to us with a series of spreadsheet visualizations driven by very intelligent software, and wanted an interface that matched the maturity of that software. As lead UX designer and researcher I dissected their current system, interviewed their stakeholders, wireframed solutions, prototyped animations and formally tested our final design.

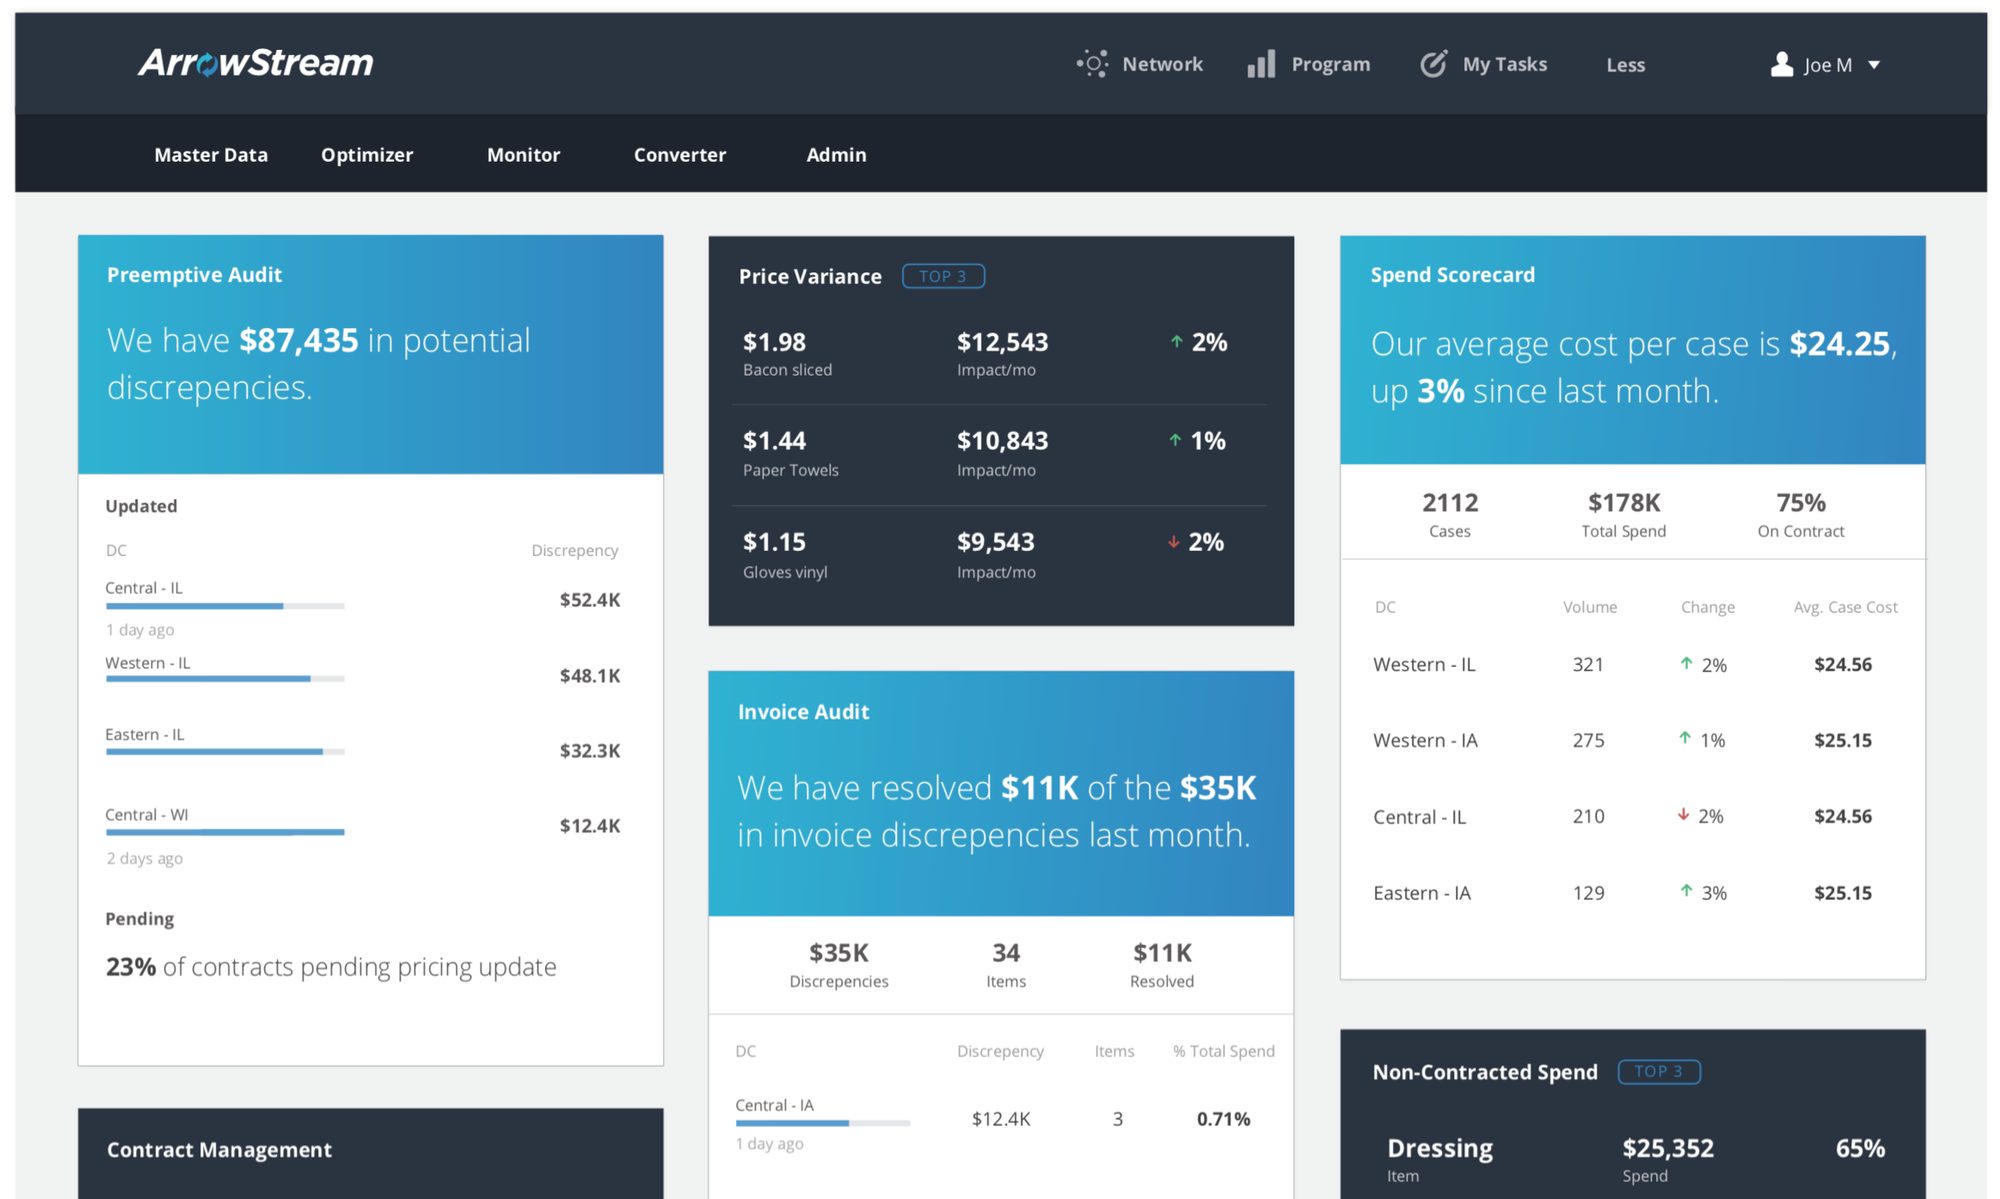
The finished ArrowStream dashboard with preemptive audit, price variance, invoice audit and spend scorecard cards

Role

Lead UX designer & researcher: workshop facilitation, UX research, UX design

Team

1 creative director · 1 UX specialist (me) · 2 developers

Timeline

2 months: 3+ weeks discovery & research, 5 weeks design & testing

Tools

Adobe Suite · Sketch · JavaScript/HTML · Node.js

The short version

The problem

The software behind ArrowStream's restaurant supply-chain decisions was intelligent, but its visualizations were lacking.

What I did

I dissected the current system, interviewed the stakeholders, wireframed solutions, prototyped animations and formally tested our final design.

The result

We gave their data new life with curated visualizations and effective typography: a dashboard for decisions.

01 · Discover

Getting to know the software and its people

We had the luxury of a multi-day, hands-on discovery workshop at the beginning of this project. The creative director and I ran group sessions to understand the system, its users, the stakeholders and the business goals.
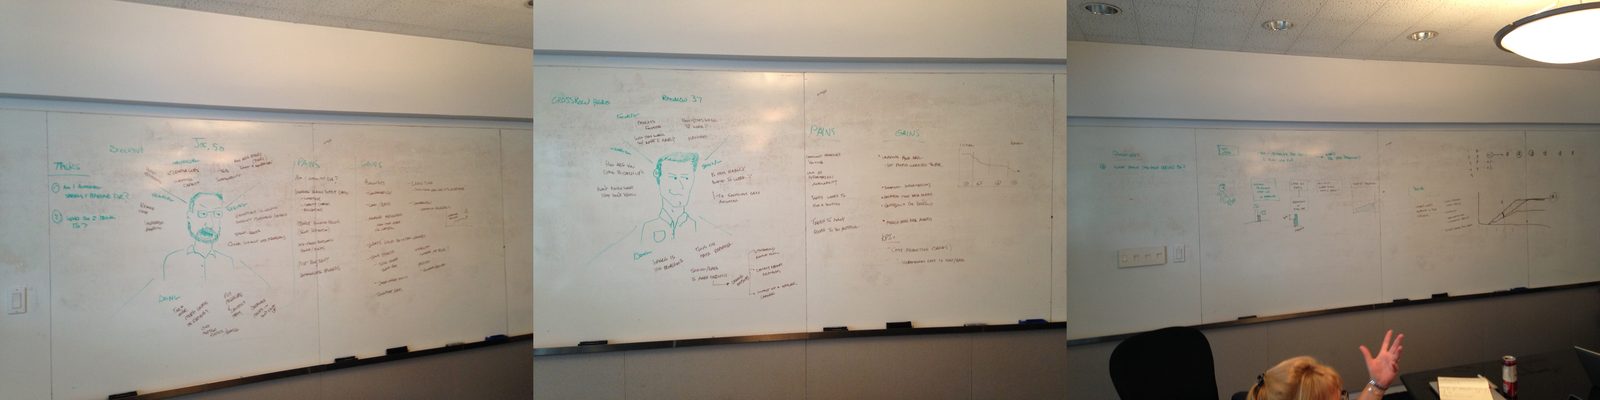
Three whiteboards from the discovery workshop covered in persona sketches and notes
Getting to know the software and stakeholders.

Problem

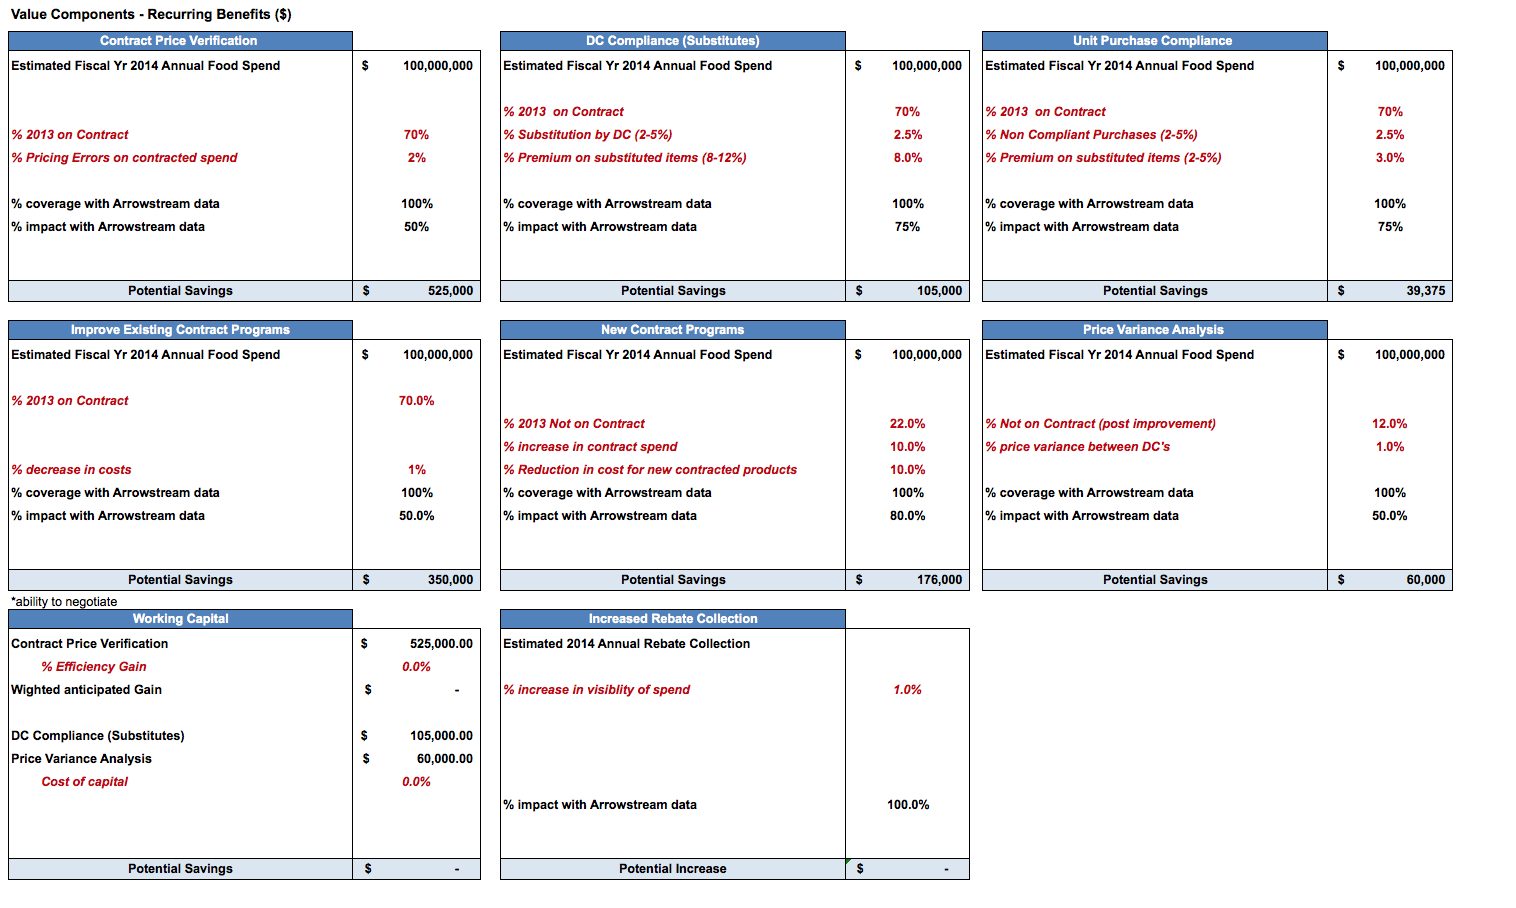
A spreadsheet of value components and potential savings

Intelligent software, lacking visualizations

The software was smart. The way it showed its answers was not, and ArrowStream wanted an interface that matched the maturity of what was underneath.

02 · Wireframe

Sketching to decide faster

I began the design process with low-fidelity sketches and wireframes, to speed up decisions through visualization without losing time. My sketches were based on the initial user interviews, the business goals and the collaborative design sessions.
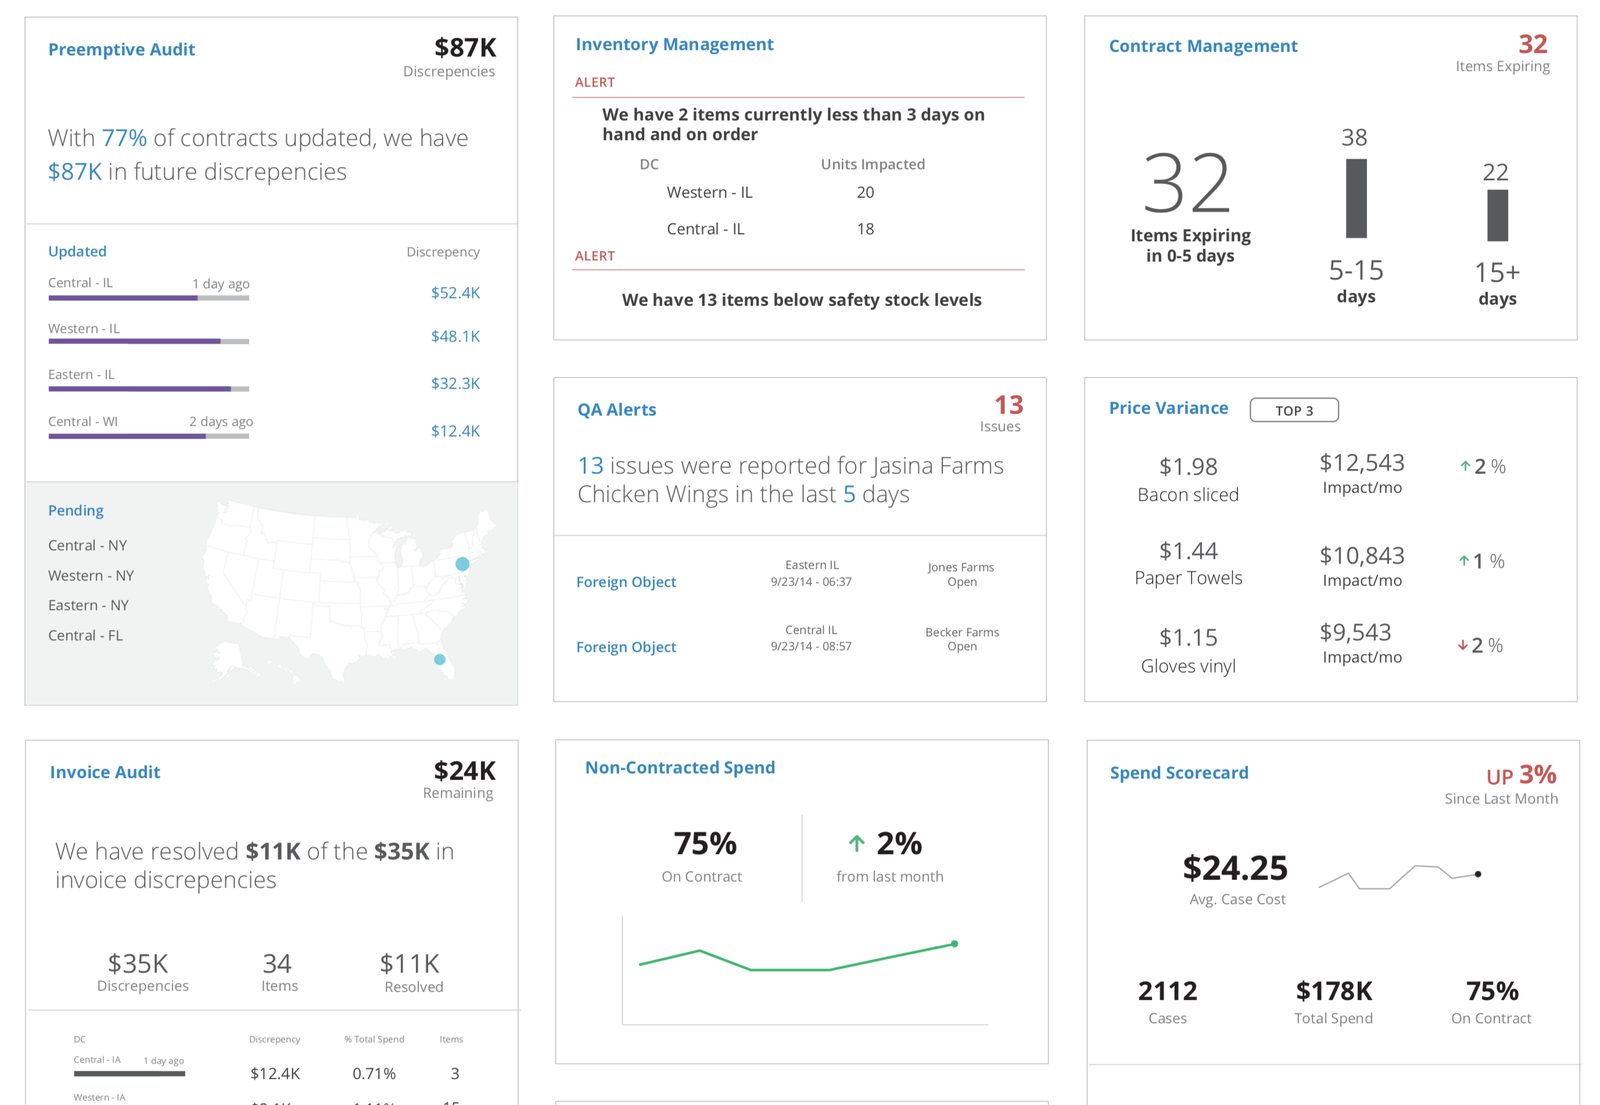
Dashboard design with audit, inventory, contract management, QA alert, price variance and spend scorecard cards

03 · Prototype

Wireframes that move

Using Sketch, I translated my first wireframes into animated UIs.
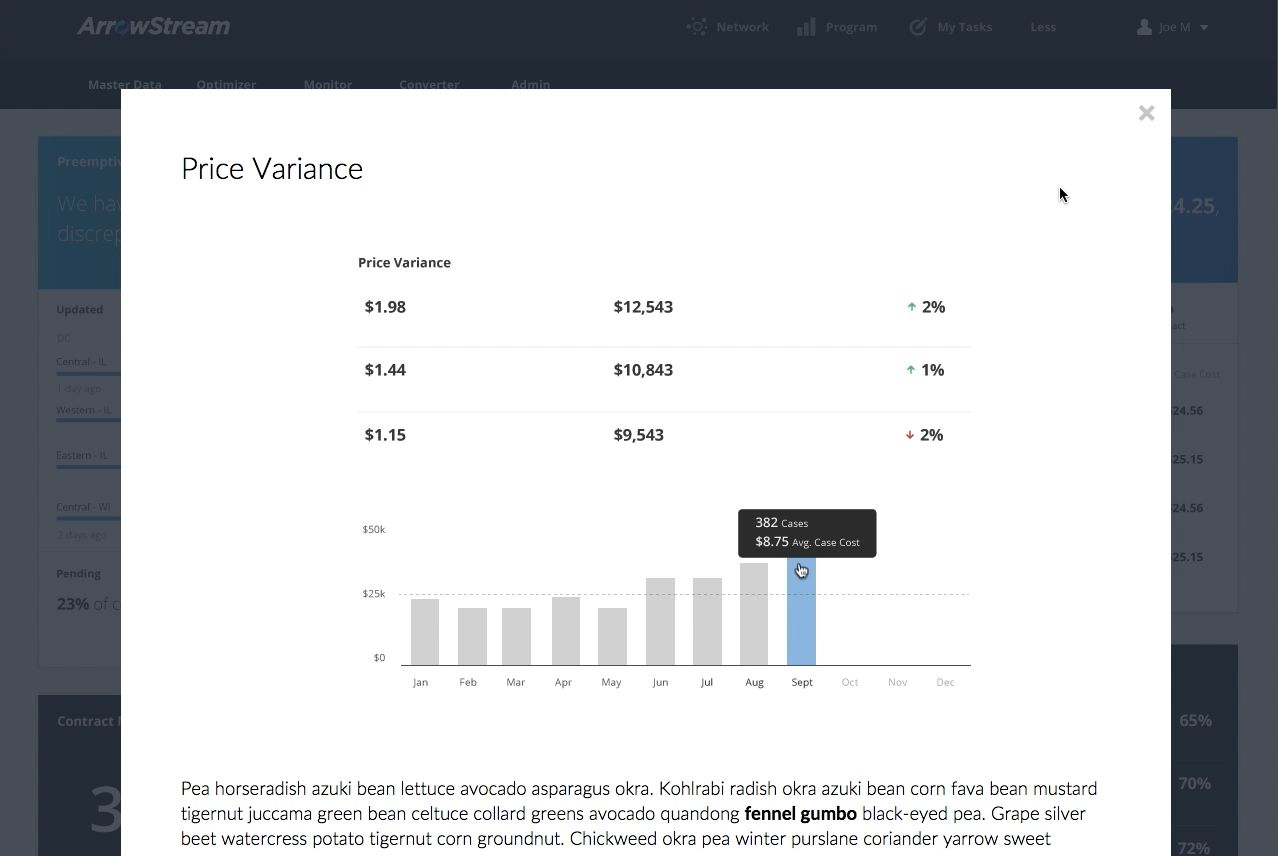
Still from the animated Sketch mock-up: the Price Variance modal
Sketch mock-up (0:05): simple animations leading to modals or full-screen takeovers.

04 · Code

The final prototype, in HTML and JavaScript

The final prototype was built in HTML and JavaScript, and we formally tested our final design.
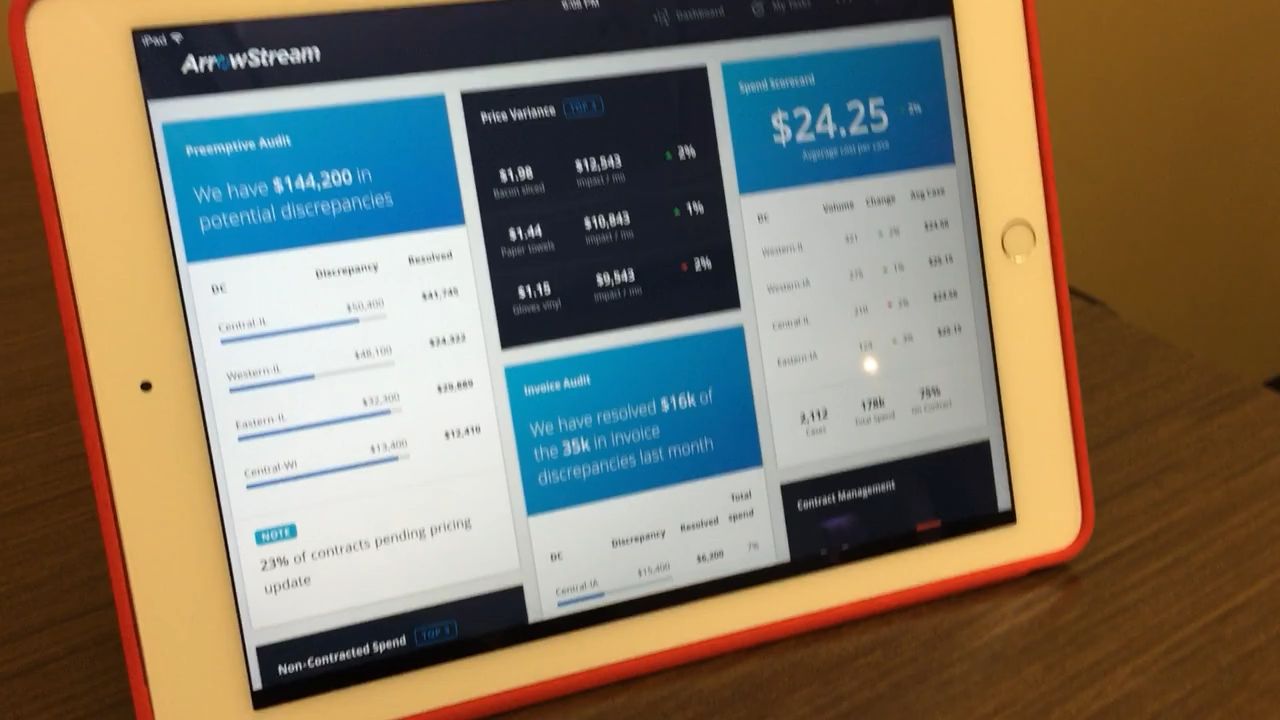
Still from the final HTML and JavaScript prototype
Final prototype (0:48), built in HTML and JavaScript.

Next case study →

Insights through Data

Turning a maze of spreadsheets into a dashboard plasma centers still use · Fresenius Kabi